Michigan Tech Research Institute (MTRI) is a recognized leader in the research, development, and practical application of sensor and information technology to solve critical problems in national security, infrastructure, bioinformatics, earth sciences, and environmental processes.
Project Contributions
Michigan Tech Research Institute’s specific objectives of the project are to continue to work collaboratively with the GLARS team to build on previous research and mapping capability to use a combination of synthetic aperture radar (SAR) and optical imagery to:
Develop algorithms to routinely monitor Great Lakes coastal wetland hydrology (surface water extent, wetland inundation extent)
Create frequent high-resolution maps of wetland type, extent and wetland change (gain and loss)
Enhance methods to detect invasive wetland plant species (e.g. Phragmites australis, European Frog Bit, invasive cattail, etc)
MTRI works with collaborators on the project to build approaches for semi-automated or automated mapping of each of these products. We are also working to extend capacity to the entire Great Lakes basin through these sensors and freely available sensors available now, such as Sentinel-1 and 2 and in the future, such as NASA-ISRO's L-band NISAR.
More Information
Great Lakes Coastal Hydrology
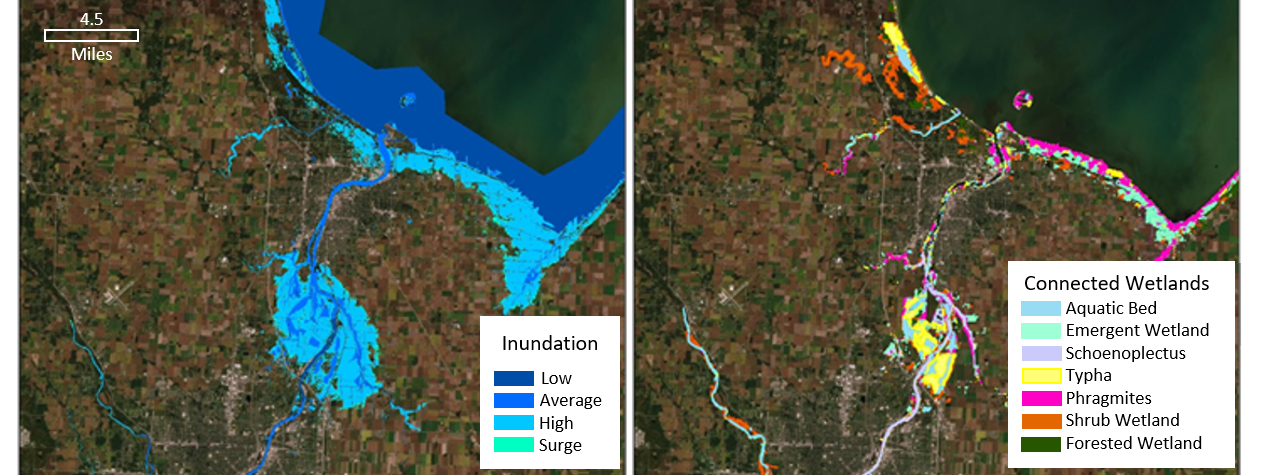
Inundation zones were mapped along the shoreline of the Great Lakes to better understand coastal wetland connectivity and the impacts of changing water levels. Inundation maps were produced from hydrological modeling using historical water levels and hydro-enforced DEMs augmented with bathymetry data. Within these inundation zones, wetlands that can receive inflows from the Great Lakes and areas that can become wetlands due to rising water levels are identified to further understand wetland gain and loss potential.
Monitoring Inundation Extent for Shore Bird Habitat
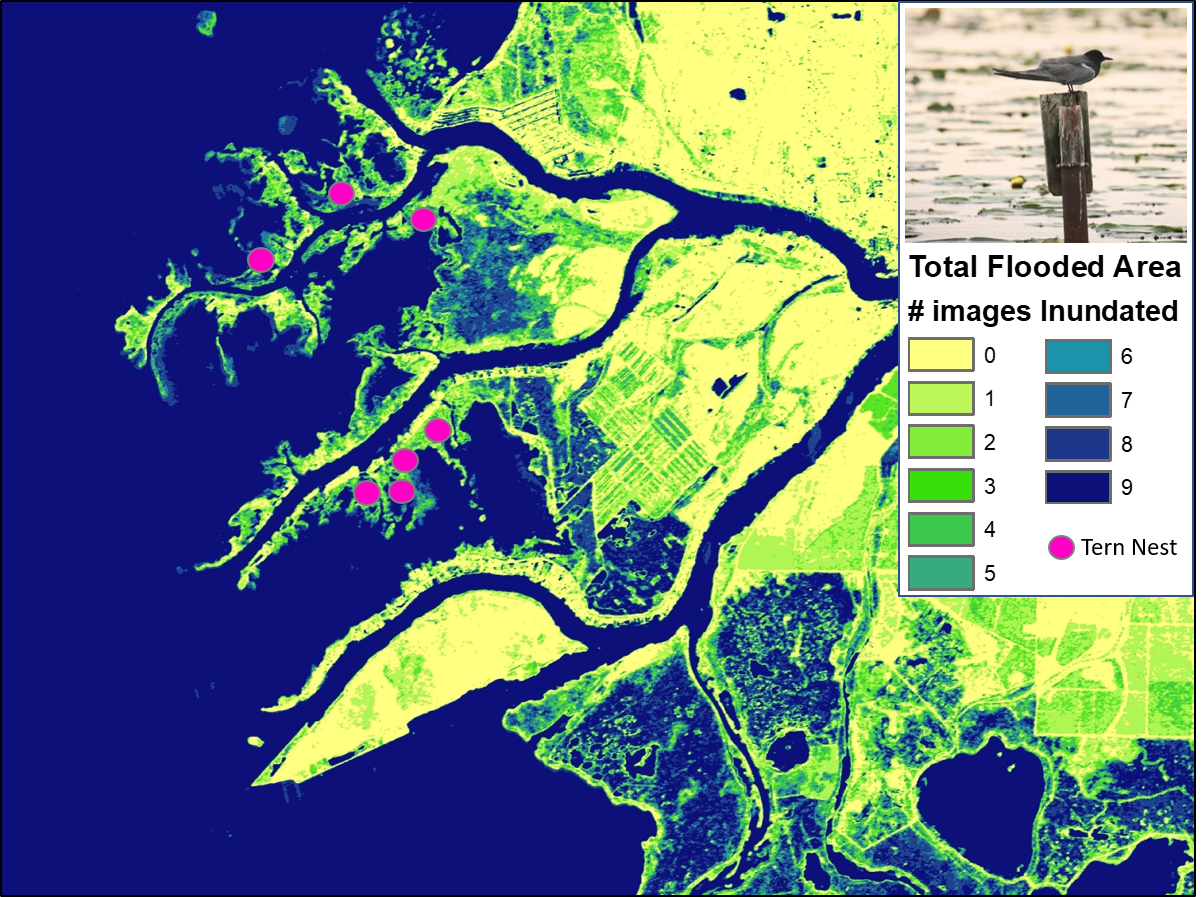
Frequent surface water extent and wetland inundation maps are created from the synthetic aperture radar (SAR) data which is sensitive to flooded vegetation of different biomass and moisture levels. These maps have been used to assess the vulnerability of coastal wetland habitat for wildlife, such as the changes in nesting area of the threatened Black Tern. Hydroperiod created through a compilation of the number of images inundated from spring through fall (images are collected every 24 days) are being assessed for helping with NWI updates of hydrologic regimes
Wetland Type Maps and Wetland Change
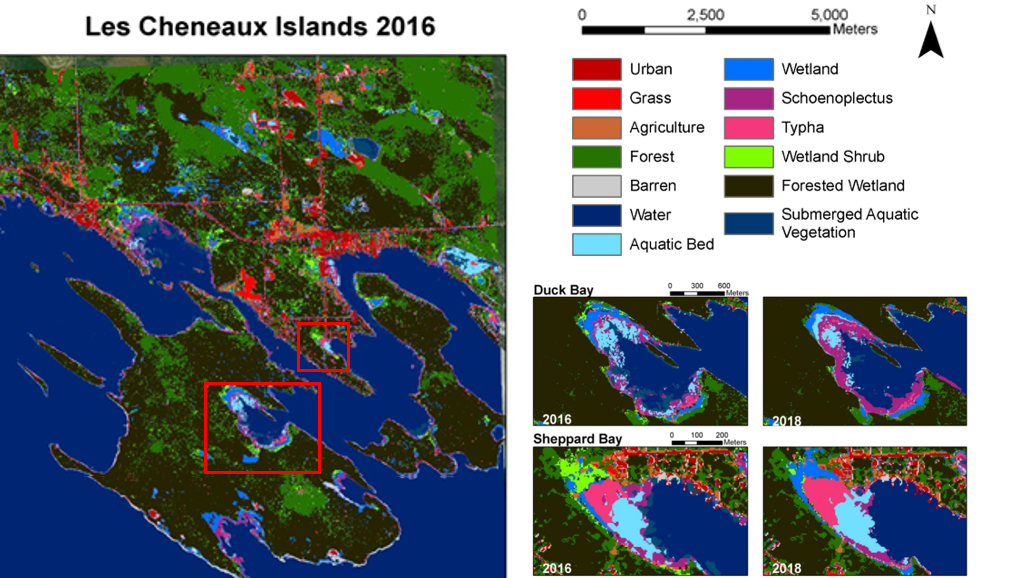
Detailed wetland ecotype maps are created by combining high-resolution optical Worldview imagery with synthetic aperture radar (SAR) RADARSAT-2 imagery from multiple dates. The combination of complementary SAR and optical data enables scientists to create dominant cover wetland maps including mapping down to specific genera, such as Typha spp., Schoenoplectus spp. and invasive species such as Phragmites australis. These wetland ecotype class maps have been generated at pilot sites across the basin for multiple years. Comparing the maps from different years as well as with inundation products allows us to identify wetland gain and loss throughout time.
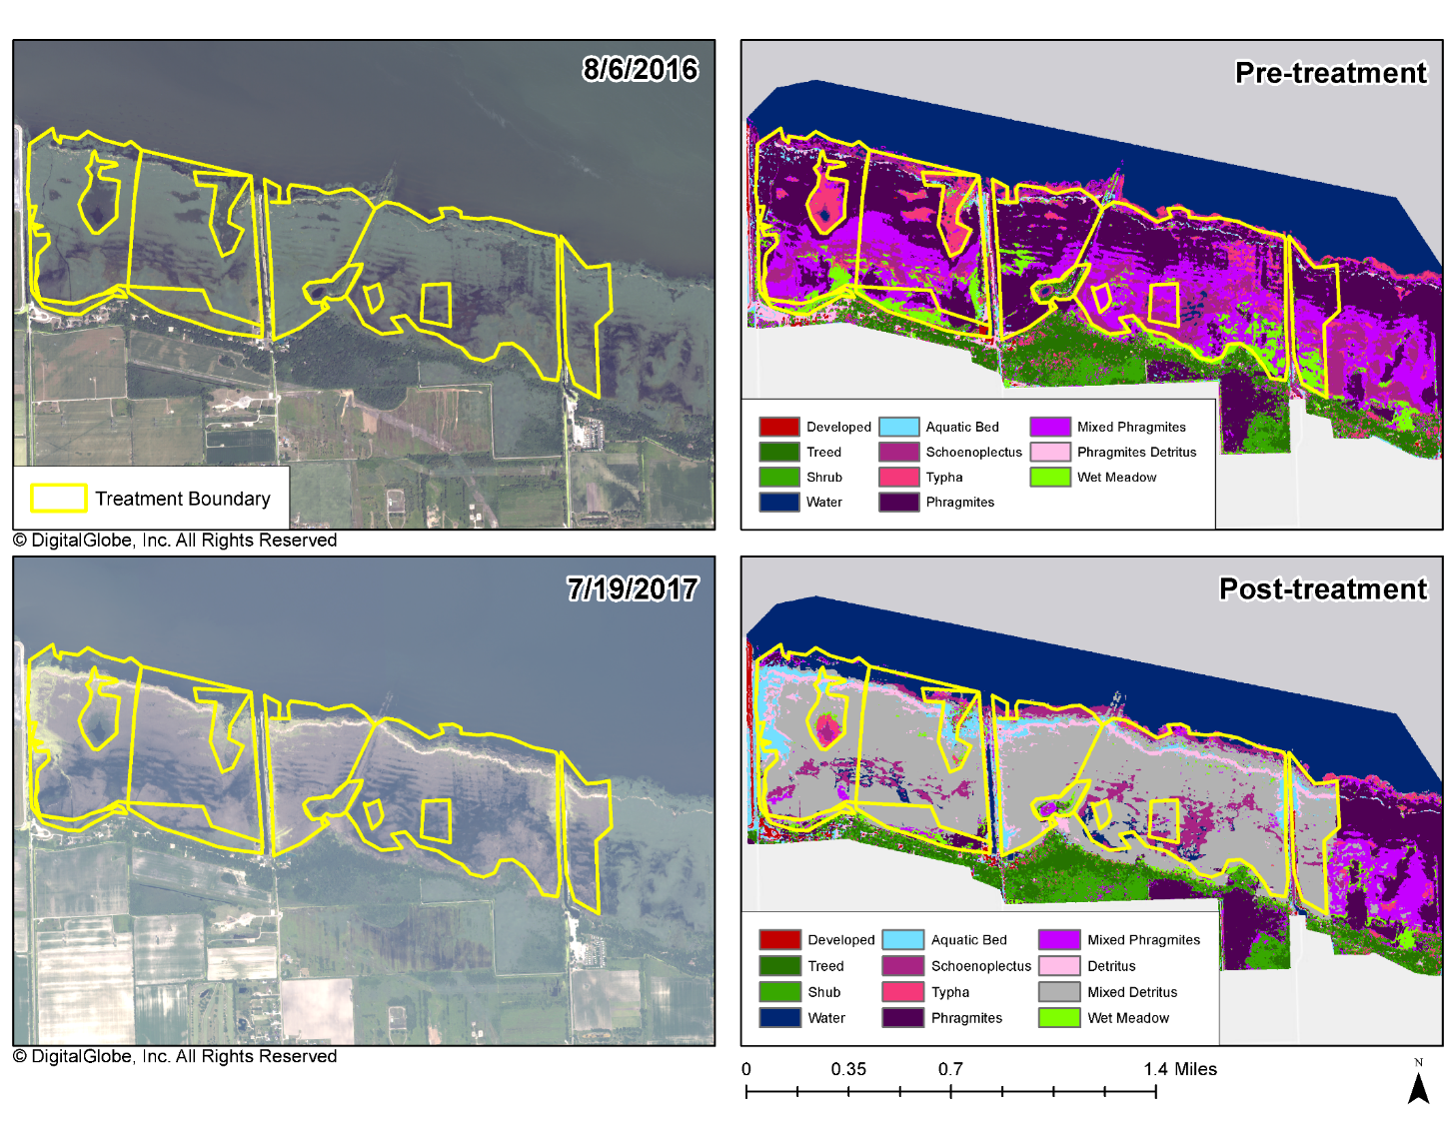
Invasive Species Mapping
Field data of invasive species locations collected by MTRI and also provided by wetland managers and government agencies were used to train machine-learning algorithms to identify invasive species such as Phragmites australis, Eurasian Water Milfoil, invasive cattail throughout selected areas of interest across the basin. In Saginaw Bay, GLARS partners have been working with managers since 2016 to treat Phragmites australis. Pre-treatment maps were generated to plan the treatment location, type, and extent. Post-treatment maps were also generated to quantify treatment success and determine if any follow-up removal was needed. A Worldview-based 2016 map of all of coastal Saginaw Bay is available for viewing and for download (by request) to aid in planning treatment (http://geodjango.mtri.org/coastal-wetlands/).